My homebrew router got fried by Lightning a couple of years ago during a thunderstorm, and facing budget constraints and limited time, I did not replace it with another homebrew router. I decided to get a Mikrotik router because I was curious about Mikrotik, and the price for the hardware + RouterOS license seemed cheaper than what it would cost to buy a new mini PC to build another homebrew router.
This is all well and good, and has been running my home network just fine, but it lacks a bandwidth monitor for my home network. I have decided to try to solve this problem with a bit of a DIY solution, and this is the first blog post documenting the first step of what will eventually become a complete bandwidth usage counter for my home network.
Requirements
- A machine to host/run the netflow or ipfix receiver. I happen to have a Raspberry Pi 5 with a high-endurance MicroSD card, and I think it will do the job just fine, and none of this data is critical.
- Software to receive the IPFIX data from your mikrotik router. PMAcct has an excellent netflow collector, and it is free and open source software with which I have some very basic experience.
- Mysql or Maria DB for storing the data and querying it for reporting.
- Consult your search engine or AI assistant of choice for help with deploying and configuring a mysql instance if required.
My first step is simply to have the traffic data collected somewhere, I will worry about visualization in a future blog post.
Note that I use pmacctd/nfacctd a bit interchangeably sometimes. pmacctd is the daemon that handles traffic via pcap while nfacctd handles netflow. The project is named pmacctd.
The Recipe
Assuming you have a fully functional raspberry pi that is up to date and accessible on your network at 192.168.1.35.
Install Pmacct
apt install pmacct
Configuration for Pmacct/nfacctd
Because we’re configuring a netflow receiver, we’re working with nfacctd here which is part of the pmacct collection. We will update the default file shipped in /etc/pmacct/nfacctd.conf . It is wise to stay with default files so that we can easily leverage the built-in systemd unit files later on.
! nfacctd configuration
!
!
!

daemonize: true
debug: false
pidfile: /var/run/nfacctd.pid
syslog: daemon
!
! interested in in and outbound traffic
aggregate[in]: src_host, dst_host, proto, tag, src_mac, dst_mac,vlan, src_port, dst_port, post_nat_dst_host, post_nat_dst_port, post_nat_src_host, post_nat_src_port
! replace zzz.zzz.zzz.zzz with your public IPv4 address.
! and do the same for your ipv6 address if you have one, or remove the condition.
aggregate_filter[in]: dst host zzz.zzz.zzz.zzz or dst net 2a02:xxxx:xxxx::/48

aggregate[out]: src_host, dst_host, proto, tag, src_mac, dst_mac,vlan, src_port, dst_port, post_nat_dst_host, post_nat_dst_port, post_nat_src_host, post_nat_src_port
aggregate_filter[out]: src net 192.168.1.0/24 or src net 2a02:xxxx:xxxx::/48

sql_user: router
sql_passwd: router
sql_db: router
sql_host: localhost

plugins: mysql[in], mysql[out]

sql_optimize_clauses: true

nfacctd_port: 2055
sql_refresh_time: 120
sql_history: 10m
sql_history_roundoff: mh
sql_table_version: 2

sql_table[in]: inbound_%m%Y
sql_table[out]: outbound_%m%Y
sql_table_schema[in]: /etc/pmacct/inbound.sql
sql_table_schema[out]: /etc/pmacct/outbound.sql
Partial explanation of the nfacctd.conf
We’re setting nfacctd to run as a daemon without debug, and to write log output to syslog. Note, on many modern linux systems with systemd, the log file is binary, and you have to use journalctl -f to see and follow the syslog output in realtime.
We have configured nfacctd to use a user called router with the same password to connect to a database of the same name, only on localhost. Please ensure that this meets your security requirements. For my use case, the raspberry pi is accessible only on my LAN, and the user account I have created only has privileges granted on the router database, so this configuration is secure enough for my home network. These options are defined with the “sql_” lines.
The sql_table_ lines allowed me to configure nfacctd so that it creates one table for inbound traffic stats, and another table for outbound traffic stats. The tables are named by month and year, for example, the table containing inbound traffic stats for June 2024 would be named: inbound_062024, and one for outbound would be outbound_062024. I have configured it this way to keep a limit on how large the tables could grow, and make it easier to delete old tables once the stats have been processed for reporting purposes.
The traffic of interest is identified with the aggregate_filter[in] and aggregate_filter[out] configurations on line 15 and 16. It uses a syntax similar to tcpdump (but I have found that it doesn’t accept all filters that tcpdump would accept. My network supports both IPv6 and IPv4, so my filters for outbound traffic match for LAN traffic originating from my network.
The aggregate_filter[in] configuration is configured this way because even though IPFIX contains the post-NAT information, I could not find a way to have nfacctd filter on that field. The workaround is to simply match all traffic inbound to the public IPv4 address of the router, and capture the post-nat IP and port details to the inbound table where post-processing later on can handle it correctly. We also capture the mac address of the client on the outbound side, because this info is available, and allows us to match ipv4 addresses to their ipv6 address when they share the same mac address.
The debug flag can be flipped to true if things aren’t quite working right, and you need to test things out.
We are using the sql_table_version 2 because it provides the primitives that are sufficient for our purpose. The aggregation command you provide needs to match include all the fields that are required for the table schema.
Please refer to the configuration reference for further details about the configuration file
Additional Files
You need to provide an SQL template for the outbound table and the inbound table that we have specified above as our preference.
File content for /etc/pmacct/inbound.sql
# ***********************************************
# place this content in /etc/pmacct/inbound.sql
#
# ***********************************************
# this is the file pointed to by the *sql_table_schema[in] configuration in
# line 35 of the nfacctd.conf file
#remove the comments

create table inbound_%m%Y (
        agent_id INT(4) UNSIGNED,
        mac_src CHAR(17) NOT NULL,
        mac_dst CHAR(17) NOT NULL,
        vlan INT(2) UNSIGNED NOT NULL,
        ip_src CHAR(50) NOT NULL,
        ip_dst CHAR(50) NOT NULL,
        src_port INT(2) UNSIGNED NOT NULL,
        dst_port INT(2) UNSIGNED NOT NULL,
        ip_proto CHAR(20) NOT NULL,
        post_nat_ip_dst VARCHAR(50) DEFAULT NULL,
        post_nat_port_src INT(2) DEFAULT NULL,
        post_nat_ip_src VARCHAR(50) DEFAULT NULL,
        post_nat_port_dst INT(2) DEFAULT NULL,
        packets INT UNSIGNED NOT NULL,
        bytes BIGINT UNSIGNED NOT NULL,
        stamp_inserted DATETIME NOT NULL,
        stamp_updated DATETIME,
        PRIMARY KEY (agent_id, mac_src, mac_dst, vlan, ip_src, ip_dst, src_port, dst_port, ip_proto,
        post_nat_ip_dst, post_nat_ip_src, post_nat_port_dst, post_nat_port_src,
        stamp_inserted)
);

# observe that the table name has %m%Y which matches the naming format for our tables.
File content for /etc/pmacct/outbound.sql
# ************************************************
# place this content in /etc/pmacct/outbound.sql
#
# ************************************************


create table outbound_%m%Y (
        agent_id INT(4) UNSIGNED,
        mac_src CHAR(17) NOT NULL,
        mac_dst CHAR(17) NOT NULL,
        vlan INT(2) UNSIGNED NOT NULL,
        ip_src CHAR(50) NOT NULL,
        ip_dst CHAR(50) NOT NULL,
        src_port INT(50) UNSIGNED NOT NULL,
        dst_port INT(2) UNSIGNED NOT NULL,
        ip_proto CHAR(20) NOT NULL,
        packets INT UNSIGNED NOT NULL,
        post_nat_ip_dst VARCHAR(50) DEFAULT NULL,
        post_nat_port_src INT(2) DEFAULT NULL,
        post_nat_ip_src VARCHAR(50) DEFAULT NULL,
        post_nat_port_dst INT(2) DEFAULT NULL,
        bytes BIGINT UNSIGNED NOT NULL,
        stamp_inserted DATETIME NOT NULL,
        stamp_updated DATETIME,
        PRIMARY KEY (agent_id, mac_src, mac_dst, vlan, ip_src, ip_dst, src_port, dst_port, ip_proto,
        post_nat_ip_dst, post_nat_ip_src, post_nat_port_dst, post_nat_port_src,
        stamp_inserted)
);
Create another table manually by executing this SQL on your database where we will eventually have pre-processed data to help speed up reporting. The two tables above will only hold relatively raw data which would need further processing depending on the kind of reporting you need to perform.
-- Table structure for main statistics cache/summary.
CREATE TABLE `main_summary` (
  `id` bigint(20) unsigned NOT NULL AUTO_INCREMENT,
  `ip` varchar(50) NOT NULL DEFAULT '0',
  `mac` CHAR(17) DEFAULT NULL,
  `duration_type` varchar(10) NOT NULL DEFAULT '0',
  `duration` varchar(12) NOT NULL DEFAULT '0',
  `bytes_in` bigint(20) unsigned DEFAULT '0',
  `bytes_out` bigint(20) unsigned DEFAULT '0',
  `stamp_inserted` datetime NOT NULL,
  PRIMARY KEY (`id`),
  UNIQUE KEY `ip_duration_type_duration` (`ip`,`duration_type`,`duration`),
  INDEX (duration),
  INDEX (ip)
) ENGINE=InnoDB DEFAULT CHARSET=utf8 COMMENT='duration type specifies whether this is a state for day, month or year. \r\n\r\nthe duration field specifies which unit of the duration the stat covers. Example, for a duration_type = day, then the duration field will contain "2018-10-15" meaning the stats are for the 15th of October 2018. For duration_type = month, you should expect "102018" meaning october 2018.'
Configure Mikrotik to send IPFIX info
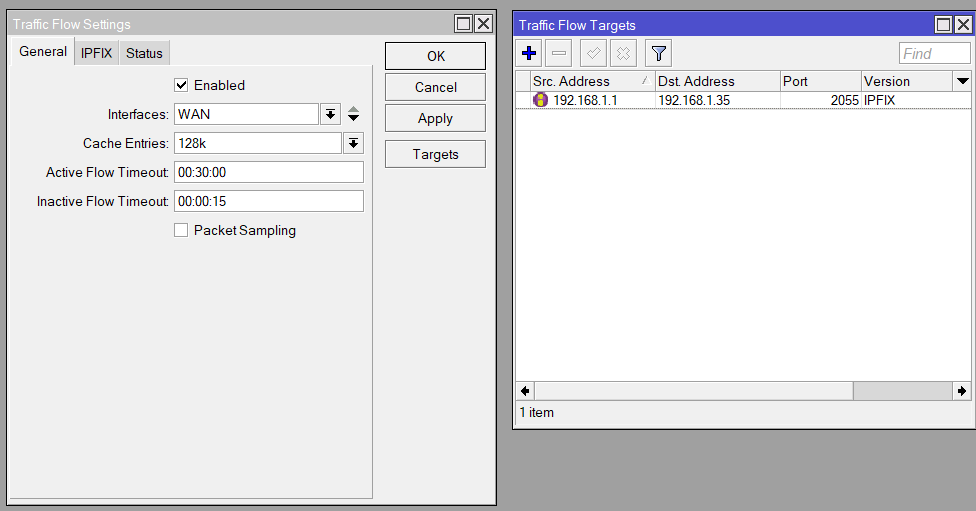
I use a GUI for my Mikrotik router, and the configuration for Traffic Flow can be found in the IP > Traffic Flow section. Here’s what I did:
- Enabled: checked
- Interfaces: WAN
- Cache Entries: 128k (default value)
- Active Flow Timeout: 00:30:00 (default value)
- Inactive Flow Timeout: 00:00:15 (default value).
Configure a Target as well. See photo. Make sure that the Source IP address is set to the router’s IP on the LAN otherwise nfacctd ignores the traffic. My nfacctd is configured to listen on port 2055, and my raspberry pi is 192.168.1.35.
Test nfacctd
Open two terminal windows to the machine running this service. In one terminal, execute
sudo nfacctd -f /etc/pmacct/nfacctd.confIn the other terminal window, watch the syslog
sudo journalctl -fYou may need to filter or grep the logs if your system is noisy and has a lot of other traffic going to syslog.
You’re looking for log messages from nfacctd that say its purging cache. Here is a sample from my machine.
Jun 30 16:06:02 vortex nfacctd[1954]: INFO ( out/mysql ): *** Purging cache - END (PID: 1954, QN: 348/348, ET: 1) ***
Jun 30 16:08:01 vortex nfacctd[1961]: INFO ( out/mysql ): *** Purging cache - START (PID: 1961) ***
Jun 30 16:08:01 vortex nfacctd[1962]: INFO ( in/mysql ): *** Purging cache - START (PID: 1962) ***
Jun 30 16:08:01 vortex nfacctd[1962]: INFO ( in/mysql ): *** Purging cache - END (PID: 1962, QN: 102/102, ET: 0) ***
Jun 30 16:08:01 vortex nfacctd[1961]: INFO ( out/mysql ): *** Purging cache - END (PID: 1961, QN: 363/363, ET: 0) ***
This happens every 2 minutes (120 seconds) from my configuration, you can set an earlier, or later time if desired. A shorter time means a mysql query is executed more often, a longer duration means that there is more data at risk of loss if the system is interrupted before the data can be committed to disk. Again, this is not valuable data, in a home use case, so there is no need to hammer the disk. I’ve chosen 2 minutes simply because the quick start guide for pmacct used 2 minutes.
There should also be some tables created for ‘inbound_MMYYYY’ and ‘outbound_MMYYYY’ by now with some data in it.
Automatically Start nfacctd on Boot
Since we have mostly stayed within the default system configuration files for pmacct, it is very easy to enable the pre-configured Systemd service to launch the daemon at system startup:
sudo systemctl enable nfacctd.serviceThat’s it, you now have traffic information being sent to your raspberry pi, getting aggregated and stored in a mysql database.
Stay tuned
Next on the agenda is to come up with a system to allow you to visualize how much data each host on your network is consuming per day, week, month or year.
To give you a hint of the kinds of things that might need doing if you’re reading this now and need this solved before I can get around to documenting my DIY solution, you can find out hos much data has been used since the start of the current month by running a query such as:
select sum(bytes) / 1000000
from router.inbound_062024
The output will be the amount of data in MB since records began for the month of June 2024. Divide by 2^20 if you prefer the output in MiB.
Discover more from nucco.org
Subscribe to get the latest posts sent to your email.
One thought to “Home Broadband Usage Monitor with Mikrotik, Netflow/IPFIX (Part 1)”